# 泰坦尼克号处理分析
从数据集中读取数据train.csv。
# 读取数据
import pandas as pd
# 读取csv文件
titanic = pd.read_csv('train.csv')
# 读取前几行,查看格式
titanic.head()
# 查看基本信息
titanic.info()
# 对每一列数据进行基本统计
titanic.describe()
#查看所有数据的中位数
titanic.median()
1
2
3
4
5
6
7
8
9
10
11
2
3
4
5
6
7
8
9
10
11
从上面可以查看文件内容的基本信息。
# 基本处理
### 统计每列为null的数量
titanic.isnull().sum()
# 可以填充整个dataframe里面的空值
titanic2=titanic.fillna(0)
# 单独选择一列进行控制填充
#titanic.Age.fillna(0)
titanic2.isnull().sum()
titanic.isnull().sum()
# 替换掉Age中的null数据
titanic.Age.fillna(titanic.Age.median(),inplace=True)
titanic.isnull().sum()
1
2
3
4
5
6
7
8
9
10
11
2
3
4
5
6
7
8
9
10
11
# 基本分析
# 根据性别分析
# 做简单的汇总统计,经常用到
titanic.Sex.value_counts()
#生还者中,男女的人数
survived = titanic[titanic.Survived == 1].Sex.value_counts()
#未生还者中,男女的人数
dead =titanic[titanic.Survived == 0].Sex.value_counts()
# 组成DataFrame
df = pd.DataFrame([survived,dead],index=['survived','dead'])
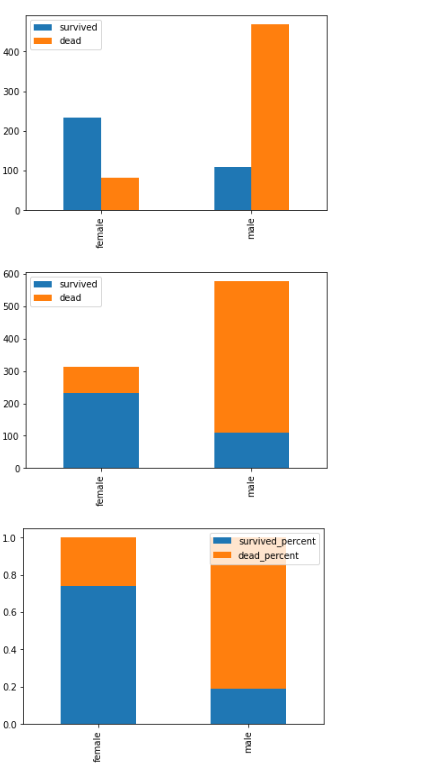
# 现在x轴是survived和dead,希望x轴是female和male
df = df.T
df.plot.bar()
# 以另一种方式查看
df.plot(kind='bar',stacked=True)
# 查看生存死亡比例
df['survived_percent']=df.survived / (df.survived +df.dead)
df['dead_percent'] = df.dead / (df.survived+df.dead)
df[['survived_percent','dead_percent']].plot.bar(stacked=True)
1
2
3
4
5
6
7
8
9
10
11
12
13
14
15
16
17
2
3
4
5
6
7
8
9
10
11
12
13
14
15
16
17
如下图:
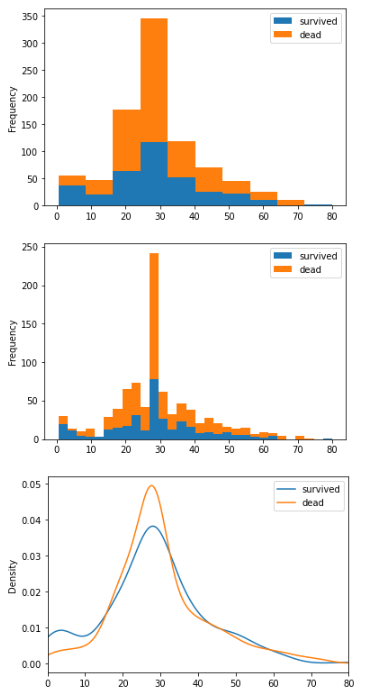
# 根据年龄分析
survived = titanic[titanic.Survived==1].Age
dead = titanic[titanic.Survived == 0].Age
df = pd.DataFrame([survived,dead],index=['survived','dead'])
# 让年龄作为x轴
df = df.T
df.plot.hist(stacked=True)
df.plot.hist(stacked=True,bins=30)
#中间很高的柱子,是因为我们把空值都替换成了中位数
#密度图
df.plot.kde(xlim=(0,80))
1
2
3
4
5
6
7
8
9
10
2
3
4
5
6
7
8
9
10
以16岁作为年轻人和老人的分界,查看他们的死亡分步情况:
age = 16
young = titanic[titanic.Age<= age]['Survived'].value_counts()
old = titanic[titanic.Age > age]['Survived'].value_counts()
df = pd.DataFrame([young,old],index=['young','old'])
df.columns=['dead','survived']
df.plot.bar(stacked=True)
# 死亡比例
df['p_survived']=df.survived / (df.survived +df.dead)
df['p_dead'] = df.dead / (df.survived+df.dead)
df[['p_survived','p_dead']].plot.bar(stacked=True)
1
2
3
4
5
6
7
8
9
10
2
3
4
5
6
7
8
9
10

# 根据票价分析
survived = titanic[titanic.Survived==1].Fare
dead = titanic[titanic.Survived==0].Fare
df = pd.DataFrame([survived,dead],index=['survived','dead'])
df = df.T
df.plot(kind='kde',xlim=(0,513))
1
2
3
4
5
2
3
4
5
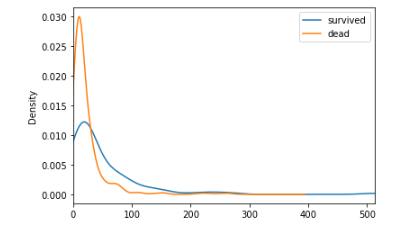
哎,低票价的死亡人数高,看来钱不是万能的,但是没钱确实不行的。
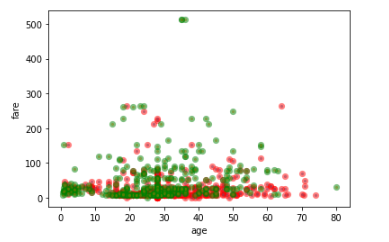
# 组合特征分析
# 根据年龄和票价
同时查看年龄和票价对生还率的影响
import matplotlib.pyplot as plt
ax = plt.subplot()
age = titanic[titanic.Survived == 0].Age
fare = titanic[titanic.Survived == 0].Fare
plt.scatter(age,fare,s=10,marker="o",alpha=0.5,linewidths=4,edgecolors="red")

age = titanic[titanic.Survived == 1].Age
fare = titanic[titanic.Survived == 1].Fare
plt.scatter(age,fare,s=10,marker="o",alpha=0.5,linewidths=4,edgecolors="green")
ax.set_xlabel('age')
ax.set_ylabel('fare')
1
2
3
4
5
6
7
8
9
10
11
2
3
4
5
6
7
8
9
10
11
# 分析隐特征
前面对于不知道年龄的人,我们使用年龄中位数填充,但是也可根据人的称谓进行分析:
titanic['title'] = titanic.Name.apply(lambda name: name.split(',')[1].split('.')[0].strip())
titanic.title.value_counts()
1
2
2
# 添加相关列
现在想算出每个人的家庭人数,并根据人数划分规模:
titanic['family_size'] = titanic.SibSp + titanic.Parch + 1
#Singleton,SmallFamily,LargeFamily
def func(family_size):
    if(family_size ==1):
        return 'Singleton'
    elif family_size <= 4 and family_size >= 2:
        return 'SmallFamily'
    elif family_size > 4:
        return 'LargeFamily'
titanic["family_type"] = titanic.family_size.apply(func)
titanic
1
2
3
4
5
6
7
8
9
10
11
2
3
4
5
6
7
8
9
10
11